
At mid-year of 2014 West Texas Intermediate (WTI) crude oil prices were trading over $100 per barrel. Just over a year later, WTI is now priced at just under $50 per barrel. This steep fall in crude prices has confounded the market from the standpoint of the magnitude of the price decline. Is the price decline simply a reaction to elevated supply due to the growth of fracking or has worldwide oil demand fallen as a result slowing global growth? We briefly address this issue in our Fall Investor Letter, but following is a closer look at oil supply and the performance of energy related investments.
An important data point will be the release of the weekly Petroleum Status Report by the Energy Information Administration (EIA) on Wednesday's at 10:30 am. Last week's EIA report noted "U.S. commercial crude oil inventories (excluding those in the Strategic Petroleum Reserve) increased by 7.6 million barrels from the previous week. At 468.6 million barrels, U.S. crude oil inventories remain near levels not seen for this time of year in at least the last 80 years (emphasis added.)
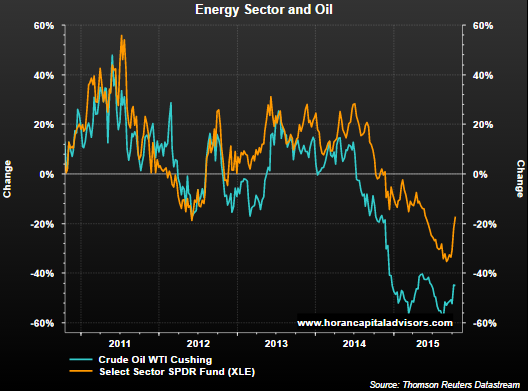
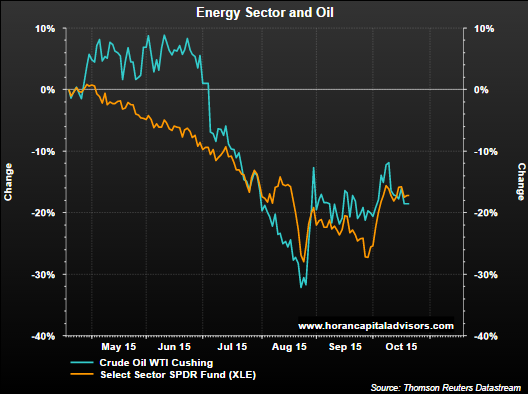
The first two charts below compare the performance of the SPDR Energy Sector ETF (XLE) to the percentage change in the price of WTI. As the first chart shows, the SPDR Energy Sector Fund ETF held up better as WTI's price began to fall beginning in 2014. One question for investors is whether the relative outperformance of XLE is justified or might it resumes its decline in order to catch up to the fall in WTI's price. The second chart compares the same two assets but on a shorter six month time frame. In this chart both XLE and WTI are once again trading in sync with one another.
 |
| From The Blog of HORAN Capital Advisors |
 |
| From The Blog of HORAN Capital Advisors |
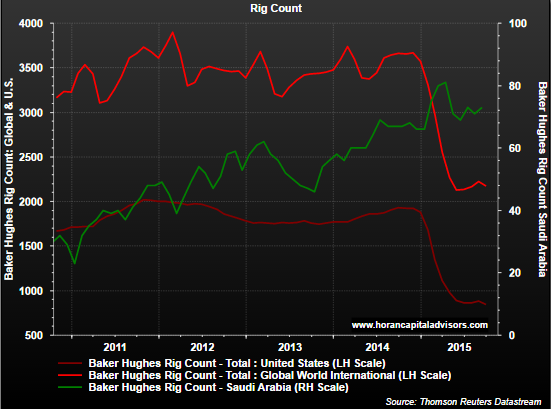
At HORAN we do believe the issues impacting oil are more supply related, yet acknowledging the continued "bump along the bottom" economic growth rate around the world. Iran indicates it will increase supply at any cost and Saudi Arabia continues with the desire not to reduce production levels. The green line in the below chart shows the rig count in Saudi Arabia and the chart clearly shows they have not reduced rig levels unlike in the U.S. and globally.
 |
| From The Blog of HORAN Capital Advisors |
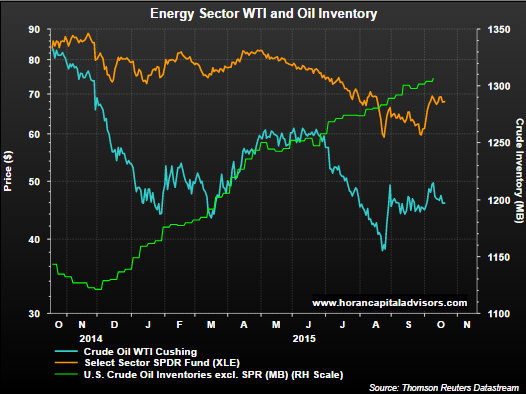
Finally turning to supply, the green line in the below chart shows the unabated oil inventory growth in the U.S. since late 2014. The currently high inventory levels seem not suggestive of an oil market where crude prices are likely to move higher in the near term. And this downward pressure on oil prices will likely be a continued headwind for energy related investments.
 |
| From The Blog of HORAN Capital Advisors |


No comments :
Post a Comment